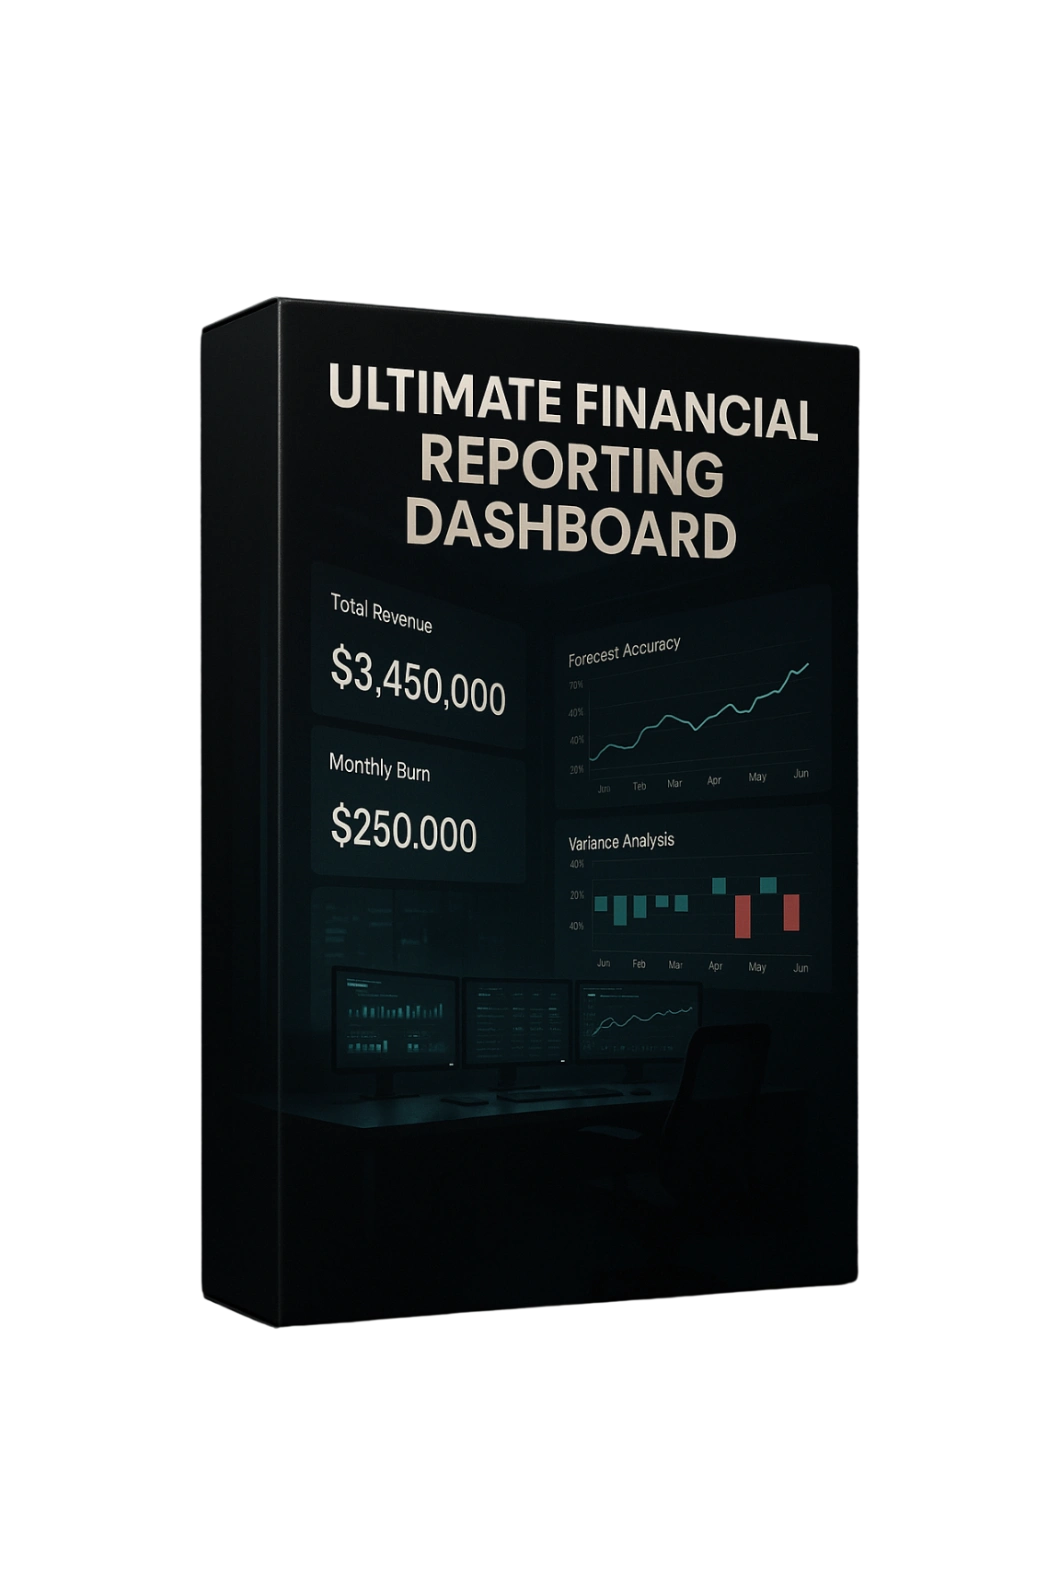
Financial Reporting Dashboard to Track Revenue, Costs & Profit
Original price was: ₹2,950.00.₹295.00Current price is: ₹295.00.
Understanding business finances requires looking at revenue and expenses together, rather than reviewing individual numbers in isolation. The Financial Reporting Dashboard to Track Revenue, Costs & Profit provides a structured framework for organizing financial records and reviewing important financial information across monthly and annual periods.
Description
📦 What’s Inside the Dashboard
💰 1️⃣ Revenue Tracking
Organize monthly and yearly revenue figures for financial reporting and review.
✅ Monthly revenue
✅ Annual revenue
✅ Revenue records
✅ Period-based comparison
✅ Revenue organization
💡 Maintain a structured view of business revenue information.
📦 2️⃣ Cost of Goods Sold Tracking
Record and review cost-of-goods-sold information alongside revenue.
✅ COGS records
✅ Cost tracking
✅ Revenue comparison
✅ Period-based review
💡 Keep product and service cost information organized alongside revenue.
📊 3️⃣ Gross Margin Analysis
Review the difference between recorded revenue and cost of goods sold through structured financial reporting.
✅ Revenue
✅ COGS
✅ Gross margin
✅ Period comparison
✅ Financial analysis
💡 Create a clearer view of gross-margin information.
💸 4️⃣ Operating Expense Tracking
Organize operating expenses and review total expense information across reporting periods.
✅ Operating expenses
✅ Expense categories
✅ Monthly expenses
✅ Annual expenses
✅ Expense review
💡 Keep operating-expense information structured for internal review.
📈 5️⃣ Financial Activity Analysis
Review EBIT, net margin and other entered financial figures within the reporting structure.
✅ Financial activity
✅ EBIT
✅ Net margin
✅ Reporting figures
✅ Period analysis
💡 Bring important financial activity into one organized reporting view.
📐 6️⃣ Ratio & Target Analysis
Review selected financial ratios and target-related information based on the data entered into the workbook.
✅ Financial ratios
✅ Target information
✅ Performance comparison
✅ Entered financial data
✅ Internal review
💡 Use structured information to compare financial figures against selected targets.
💵 7️⃣ Cash Inflows & Outflow Tracking
Organize sales revenue, investment income, financing, operating expenses, debt repayments, capital expenditures, dividends and other configured cash-flow categories.
✅ Cash inflows
✅ Cash outflows
✅ Operating cash activity
✅ Investment-related activity
✅ Financing activity
💡 Maintain organized cash-flow records across relevant categories.
💰 8️⃣ Net Cash Flow View
Review the difference between recorded cash inflows and outflows across monthly periods.
✅ Cash inflows
✅ Cash outflows
✅ Net cash flow
✅ Monthly review
💡 Maintain a structured view of net cash-flow information.
🏦 9️⃣ Beginning & Ending Cash Balance
Maintain and review cash-balance information throughout the reporting period.
✅ Beginning balance
✅ Ending balance
✅ Cash movement
✅ Period review
💡 Keep cash-balance information organized alongside financial activity.
📅 🔟 Monthly & Yearly Reporting
Compare financial figures across individual months and review yearly totals and budget information.
✅ Monthly reporting
✅ Yearly reporting
✅ Annual totals
✅ Budget comparison
✅ Period analysis
💡 Review financial information across different reporting periods.
📑 1️⃣1️⃣ Detailed Financial Report
Review organized income-statement information including revenue, COGS, gross margin, operating expenses, total expenses, EBIT, tax and net margin.
✅ Revenue
✅ COGS
✅ Gross margin
✅ Operating expenses
✅ Total expenses
✅ EBIT
✅ Tax
✅ Net margin
💡 Bring key financial-reporting information together for structured review.
💚 Why You’ll Love It
✔ Brings revenue, costs, expenses, margins and cash-flow information into one structured dashboard.
✔ Makes monthly and yearly financial information easier to organize and review.
✔ Provides dedicated views for detailed reporting and financial analysis.
✔ Helps compare entered financial activity with budget and target information.
✔ Keeps cash inflows, outflows and balances organized alongside financial reporting data.
✔ Provides a centralized reference for internal financial review and planning.
✔ Helps maintain financial information in a consistent reporting structure.
👥 Perfect For
✔ Business Owners
✔ Finance & Accounting Teams
✔ Accountants & Bookkeepers
✔ Small & Medium Businesses
✔ Financial Managers
✔ Entrepreneurs & Startups
✔ Retail & Trading Businesses
✔ Manufacturing Businesses
✔ Service-Based Businesses
🎁 Key Dashboard Areas
📊 Revenue Tracking
📦 Cost of Goods Sold
📈 Gross Margin Analysis
💸 Operating Expenses
📑 EBIT & Net Margin
💰 Tax Figures
📐 Ratio & Target Analysis
💵 Cash Inflows
💳 Cash Outflows
💰 Net Cash Flow
🏦 Cash Balance Tracking
📅 Monthly & Annual Reporting
🧠 How to Use
1️⃣ Select the year you want to review in the dashboard.
2️⃣ Enter monthly cash inflows and outflows in the relevant year sheet.
3️⃣ Add sales, investment, loans, expenses, repayments, capital spending and dividends.
4️⃣ Review net cash flow and beginning/ending cash balances for each month.
5️⃣ Use the dashboard to compare yearly cash performance and variance.
💡 Simple workflow: Enter → Track → Calculate → Compare → Review.
🌟 Use Case Examples
| Who Uses It | How It Helps |
|---|---|
| Business Owners | Organize revenue, costs, expenses and supporting financial records. |
| Finance & Accounting Teams | Maintain financial records, reporting information and analysis. |
| Accountants & Bookkeepers | Organize financial figures, reporting categories and supporting records. |
| Small & Medium Businesses | Build a structured financial-reporting resource for internal review. |
| Financial Managers | Organize budgets, expenses, margins and financial information. |
| Entrepreneurs & Startups | Maintain a broader financial reporting and business-documentation framework. |
| Retail & Trading Businesses | Organize revenue, costs, cash flow and financial activity. |
| Manufacturing Businesses | Review revenue, costs, expenses and financial reporting information. |
| Service-Based Businesses | Maintain revenue, expense and financial records in one structured system. |
🚀 Result
Create a clear and structured financial reporting view by bringing revenue, costs, expenses, margins, taxes, cash flow, budgets and related financial activity together in one organized dashboard.
Use the dashboard and supporting worksheets to maintain financial records, review entered figures, compare reporting periods and support internal business planning with structured financial information.
📊 Track Revenue. Organize Costs. Review Financial Activity with Greater Clarity.
Related products
-

Manufacturing Tooling Cost Amortization Planner
Original price was: ₹3,500.00.₹349.00Current price is: ₹349.00. Add to cart Buy Now -

The Ultra Lead Nurturing & Sales Funnel Blueprint
Original price was: ₹2,000.00.₹247.00Current price is: ₹247.00. Add to cart Buy Now -

Business Manufacturing Toolkit — Complete Suite (All 17 Tools)
Original price was: ₹6,514.00.₹2,999.00Current price is: ₹2,999.00. Add to cart Buy Now -
Manufacturing Production Planning & Factory Control Toolkit with 17 Premium Bonuses🎁Absolutely FREE
Original price was: ₹10,000.00.₹999.00Current price is: ₹999.00. Add to cart Buy Now

Reviews
There are no reviews yet.